FlexReport 定義には複数のデータソースを設定でき、これらのデータソースには C1FlexReport.DataSources コレクションからアクセスできます。このコレクション内のデータソースは、一意の名前で識別されます。これらのデータソースは次のように使用できます。
| メインデータソース | これはレポートのメインデータソースです。メインデータソースは、レポートの C1FlexReport.DataSourceName プロパティを使用して指定します。メインデータソースが指定されていない場合(DataSourceName が空、または DataSources コレクションにない名前が指定されている)、C1FlexReport は非連結モードでレンダリングされ、詳細セクションが 1 つだけ含まれます。 |
| パラメータ用のデータソース | これは、レポートパラメータ(C1FlexReport.Parameters コレクション内の要素)として有効な値のソースです。パラメータ用のデータソースは、ReportParameter.AllowedValuesDefinition.Binding.DataSourceName プロパティを使用して指定します。 |
| チャート用のデータソース | これは、チャートフィールド用のデータソースです。チャート用のデータソースは、ChartFieldクラスのDataSource プロパティを使用して指定します。 |
The list of supported data-source types in FlexReport are as follows:
- OLE DB
- ODBC
- XML
- Object in external assembly
- Microsoft SQL Server Compact Data Provider version 3.5 and 4.0
- SQLite
- C1 ADO.NET DataConnectors
レガシーC1Report との下位互換性のため、C1FlexReport には DataSources[DataSourceName] を指す DataSource プロパティがあります。新しい C1FlexReport を作成すると、「Main」という名前の 1 つの要素が C1FlexReport.DataSources コレクションに追加され、「Main」が C1FlexReport.DataSourceName プロパティに割り当てられます。C1Report では、メインデータソースがレポートの唯一のデータソースです。
複数のデータソースへの接続
「FlexReport クイックスタート」では、メインデータソースに連結されるレポートの作成方法を学習しました。1 つのレポートが複数のデータソースを持つことができるため、チャートやパラメータを使用しながら、これらのデータソースへの接続方法について学習する必要があります。
以下のセクションでは、複数のデータソースを使用するレポートで、チャートやパラメータにデータを連結する方法について説明します。
チャートへのデータの連結
レポートにチャートフィールドを追加する際は、最初の手順としてチャートをデータソースに連結します。
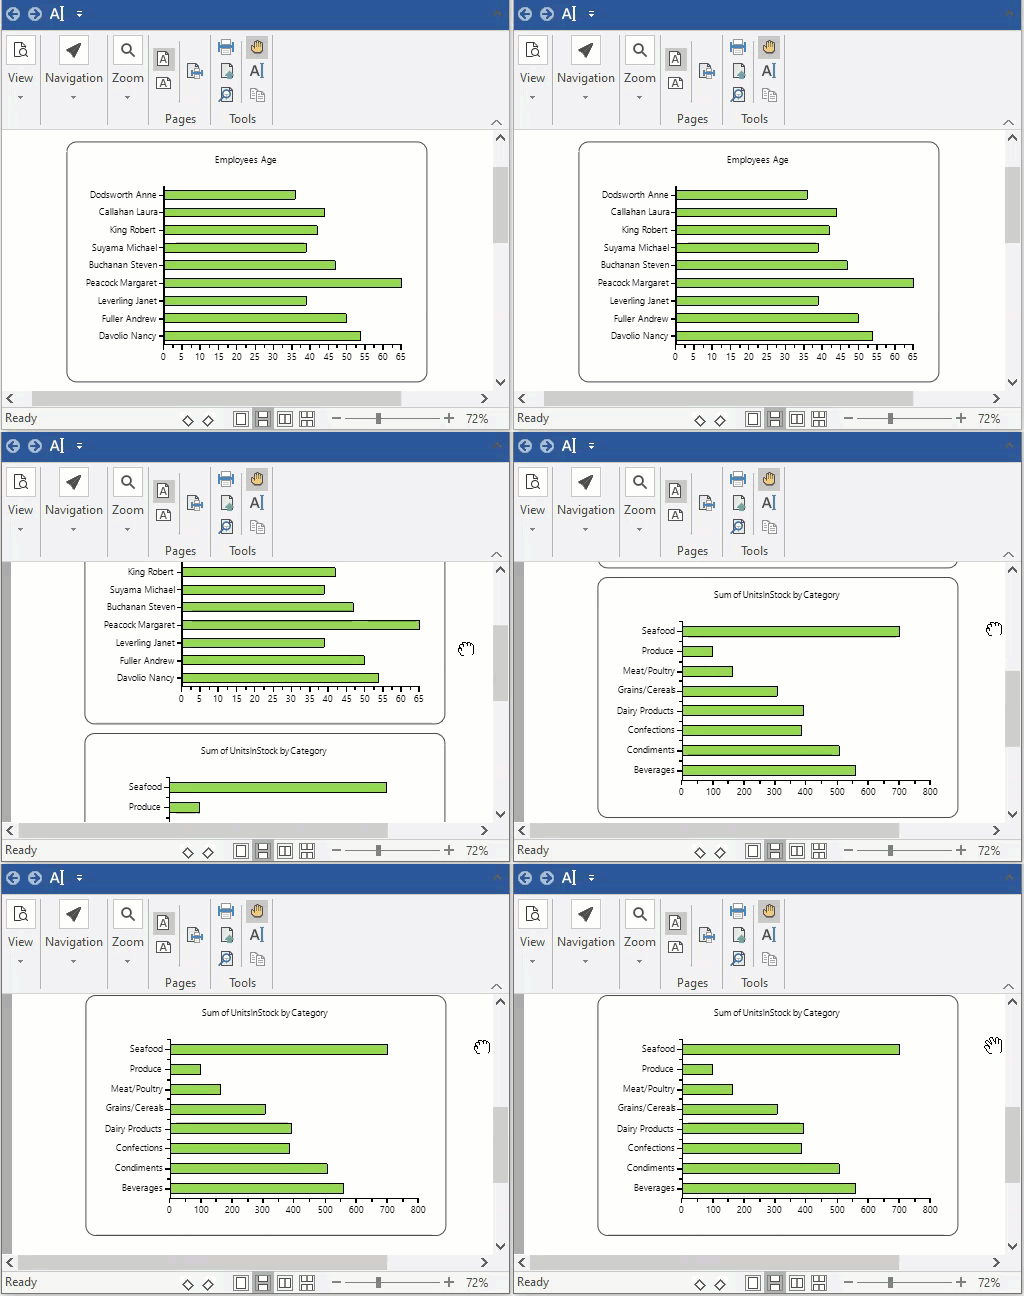
たとえば、レポートに「Employees」と「Products」という 2 つのデータソースがあるとします。Employees データソースの FullName と Age を表示するチャートと、Products データソースの CategoryName と Sum(UnitsInStock) を表示するチャートの 2 つを作成します。
次の手順で、このシナリオを実現できます。
- レポートで 2 つのデータソース「Employees」と「Products」を作成します。
- Employees データソースで 2 つの計算フィールド「FullName」と「Age」を定義します。
- Products データソースで 2 つの計算フィールド「CategoryName」と「Sum(UnitsInStock)」を定義します。
- Employees データソースと Products データソースに個別に連結する 2 つのチャートフィールドを作成します。 For this purpose, you can use the Chart2DType enumeration of C1.Win.FlexReport.Chart namespace, which specifies the type of 2D chart. Here, we have used the Bar chart.
The following code illustrates the scenario:
C# コードのコピーprivate C1FlexReport CreateChartSampleReport() { var report = new C1FlexReport { ReportName = "ChartSample" }; // レポートをプレビューします c1FlexViewer1.DocumentSource = report; // データソース「Employees」を追加します var dsEmployees = new DataSource { Name = "Employees", ConnectionString = @"Provider=Microsoft.ACE.OLEDB.12.0;Data Source=C:\Users\GPCTAdmin\Documents\ComponentOne Samples\Common\C1NWind.mdb", RecordSource = "Select * from Employees" }; report.DataSources.Add(dsEmployees); // 計算フィールド「FullName」を追加します var calcFullName = new CalculatedField("FullName", typeof(string), "=LastName & \" \" & FirstName"); dsEmployees.CalculatedFields.Add(calcFullName); // 計算フィールド「Age」を追加します var calcAge = new CalculatedField("Age", typeof(int), "=Year(Now())-Year(BirthDate) + 1"); dsEmployees.CalculatedFields.Add(calcAge); // データソース「Products」を追加します var dsProducts = new DataSource { Name = "Products", ConnectionString = @"Provider=Microsoft.ACE.OLEDB.12.0;Data Source=C:\Users\GPCTAdmin\Documents\ComponentOne Samples\Common\C1NWind.mdb", RecordSource = "Select Products.CategoryID as CategoryID, Categories.CategoryName as CategoryName, Products.UnitsInStock as UnitsInStock from Products inner join Categories on Products.CategoryID = Categories.CategoryID" }; report.DataSources.Add(dsProducts); report.Sections.Header.Visible = true; // Employeesデータソースを使用してChartFieldを追加します var sectionEmployees = report.Sections.Header.SubSections.Add(); sectionEmployees.Name = "ChartWithEmployees"; sectionEmployees.Height = 5200; sectionEmployees.Visible = true; sectionEmployees.Fields.Add(CreateChartForEmployees()); // Productsデータソースを使用してChartFieldを追加します var sectionProducts = report.Sections.Header.SubSections.Add(); sectionProducts.Name = "ChartWithProducts"; sectionProducts.Height = 5200; sectionProducts.Visible = true; sectionProducts.Fields.Add(CreateChartForProducts()); return report; } private ChartField CreateChartForEmployees() { var chart = CreateChartField("Chart1", "Employees"); chart.Header.Text = "Employees Age"; chart.ChartArea2D.Inverted = true; chart.ChartArea2D.AxisX.OnTop = true; var group = chart.ChartGroups2D.Group0; group.ChartType = Chart2DType.Bar; var data = group.ChartData; data.IsForEachRecord = true; // データソースの各レコードの値を表示します data.CategoryGroups.AddNewGroup("=FullName"); // FullNameでグループ化します var seriesTemplate = data.SeriesValues.AddNewSeries(); seriesTemplate.DataValues.AddNewValue("=Age"); // AxisYで年齢を表示します return chart; } private ChartField CreateChartForProducts() { var chart = CreateChartField("Chart2", "Products"); chart.Header.Text = "Sum of UnitsInStock by Category"; chart.ChartArea2D.Inverted = true; chart.ChartArea2D.AxisX.OnTop = true; var group = chart.ChartGroups2D.Group0; group.ChartType = Chart2DType.Bar; var data = group.ChartData; var categoryGroup = data.CategoryGroups.AddNewGroup("=CategoryID"); // 各CategoryIDでグループ化します categoryGroup.LabelExpression = "=CategoryName"; // AxisXでCategoryNameを表示します var seriesTemplate = data.SeriesValues.AddNewSeries(); seriesTemplate.DataValues.AddNewValue("=Sum(UnitsInStock)"); // AxisYのUnitsInStockの合計を表示します return chart; } private ChartField CreateChartField(string name, string datasource) { var chart = new ChartField { Name = name, Width = 7500, Height = 5000, Top = 100, Left = 100, DataSource = datasource, }; chart.Border.Color = Color.Black; chart.Border.Width = 15; chart.Border.Style = C1.Win.Document.DashStyle.Solid; chart.Border.CornerRadius = new CornerRadius(200d); chart.ChartArea2D.AxisY.AutoMin = false; return chart; } private void Form1_Load(object sender, EventArgs e) { CreateChartSampleReport(); }
The resulting output in FlexViewer preview looks like the GIF below:

As you can observe from the above code snippet, Calculated Fields have been used, which contain expressions that are evaluated at run-time. These can be added to a data source using DataSource.CalculatedFields property.
Note: If there are more than one Calculated field, they must have unique names.
パラメータへのデータの連結
パラメータにデータを連結することで、レポートパラメータ(C1FlexReport.Parameters コレクション内の要素)に対して有効な値が定義できます。ReportParameter.AllowedValuesDefinition.Binding.DataSourceName プロパティは、有効なパラメータ値のリストを作成するために使用されるデータソースを示します。次のコード例は、複数のデータソースを含むレポートのパラメータにデータを連結する方法を示します。
The following code illustrates how to bind data to the parameters in a report with multiple data sources.
| C# |
コードのコピー
|
|---|---|
// データソースおよびこのデータソースを使用するパラメータを追加します DataSource mds = c1FlexReport.DataSource; DataSource ds = new DataSource(); ds.Name = "CategoriesDS"; ds.ConnectionString = mds.ConnectionString; ds.RecordSource = "select * from categories"; ds.DataProvider = DataProvider.OLEDB; c1FlexReport.DataSources.Add(ds); mds.RecordSource = "select * from products where categoryid = [CategoryParam]"; ReportParameter rp = new ReportParameter(); rp.DataType = Doc.ParameterType.Integer; rp.Prompt = "Category"; rp.Name = "CategoryParam"; rp.AllowedValuesDefinition.Binding.DataSourceName = "CategoriesDS"; rp.AllowedValuesDefinition.Binding.ValueExpression = "CategoryID"; rp.AllowedValuesDefinition.Binding.LabelExpression = "CategoryName"; c1FlexReport.Parameters.Add(rp); |
|