This is a simple yet comprehensive quickstart to get you started with FlexReport. Here, you will learn how to initially create a report definition, modify the report, and then load and render it.
レポート定義を作成する
このトピックでは、FlexReportDesigner アプリケーションとコードを使用してレポート定義を作成する方法について説明します。レポート定義を作成する最も簡単な方法は、C1FlexReportDesigner を使用することです。これは、Microsoft Access のレポートデザイナや Crystal Report に似たスタンドアロンアプリケーションです。
The C1FlexReportDesigner.exe for 64-bit platform and C1FlexReportDesigner32.4.exe for 32-bit platform are located at C:\Program Files (x86)\ComponentOne\Apps\v4.5.2 on your computer.
FlexReportDesigner provides the FlexReport Wizard, a report engine to create reports for effective data presentation and analysis. With the wizard, you can choose a suitable datasource, select fields, layouts and style, and further add a title to the new report.
To begin, complete the following steps:
- Run the C1FlexReportDesigner.exe file.
- Go to File menu in the menu bar and select the New command to create a new empty report definition file.
- Click New Report dropdown from the Reports tab located on the extreme left of designer and select Report Wizard.
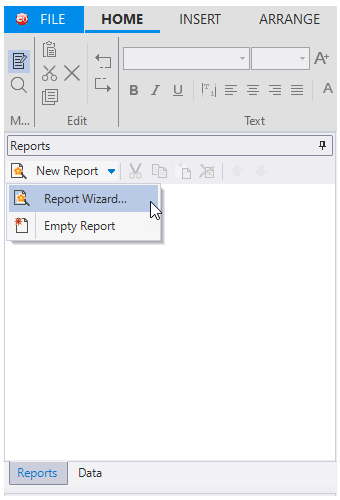
The FlexReport Wizard opens.
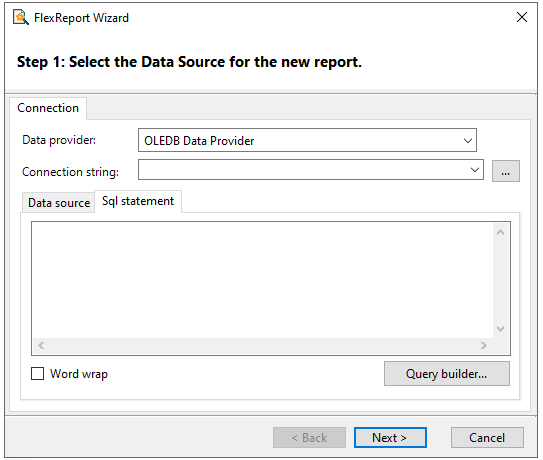
Here, we have used 'OLEDB Data Provider' as the data provider. You can also choose any other data provider from the drop-down button.
Using the FlexReport Wizard, complete the following steps to add a data source in the new report:
-
省略符ボタンをクリックして、標準の接続文字列ビルダを起動します。[データリンクプロパティ]ダイアログボックスが開きます。
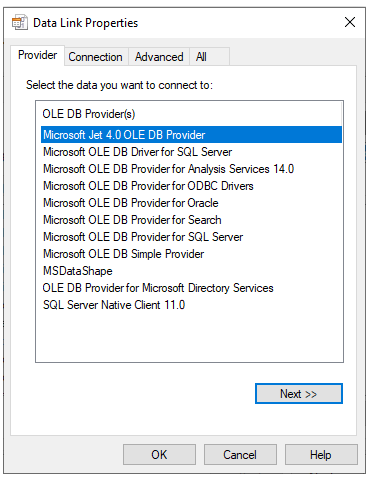
- [プロバイダ]タブを選択し、リストからデータプロバイダを選択します。この例では、Microsoft Jet 4.0 OLE DB Provider を選択します。
- [次へ]ボタンをクリックするか、[接続]タブを選択します。ここで、データソースを選択する必要があります。
-
省略符ボタンをクリックしてデータベースを選択します。[Access データベースの選択]ダイアログボックスが表示されます。この例では、(デフォルトでは Documents フォルダにインストールされる)ComponentOne Samples ディレクトリの Common フォルダにある C1NWind.mdb を選択します。このディレクトリはデフォルトのインストールパスに基づいていますが、インストールパスを変更した場合は、パスが異なる場合があります。
[開く]をクリックします。接続をテストし、[OK]をクリックします。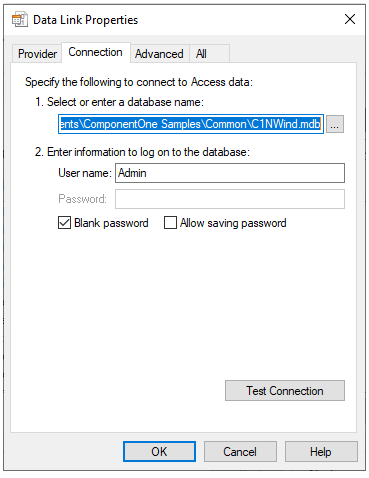
- [OK]をクリックして、[データリンクプロパティ]ダイアログボックスを閉じます。
- データソースを選択したら、テーブル、ビュー、またはストアドプロシージャを選択して実際のデータを提供できます。DataSource.RecordSource の文字列は、次の 2 つの方法で指定できます。
- Select the Data source tab and select the Products table from the Tables list.
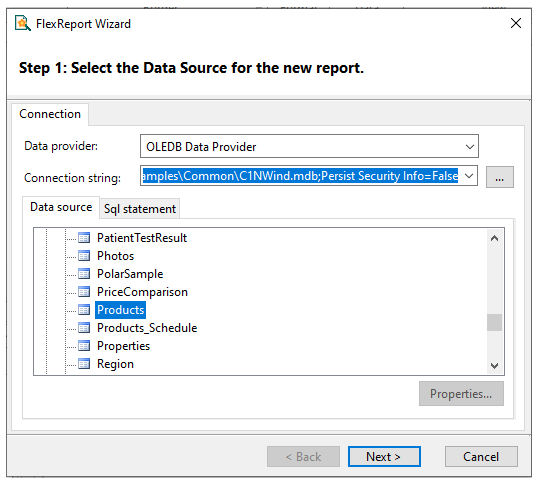
- Or, select the SQL tab and type (or paste) an SQL statement into the editor.
For example:
select * from products
- Select the Data source tab and select the Products table from the Tables list.
- [次へ]をクリックします。
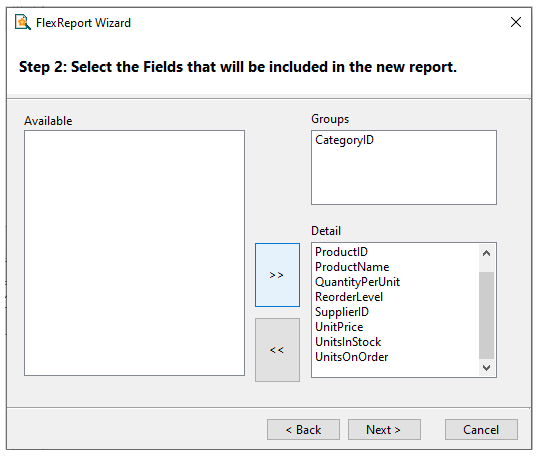
- レポートに含めるフィールドを選択します。
このページには、手順 6 で選択したレコードセットにあるフィールドのリスト、およびレポートのグループフィールドと詳細フィールドを定義する 2 つのリストが表示されます。グループフィールドはデータのソート方法と集計方法を定義し、詳細フィールドはレポートに表示する情報を定義します。マウスポインタを使用してドラッグすることで、リスト間でフィールドを移動することができます。フィールドを[詳細]リストにドラッグしてレポートに入れたり、リスト内でフィールドをドラッグして順序を変更することができます。レポートからフィールドを削除する場合は、フィールドをドラッグして[利用可能なフィールド]リストに戻します。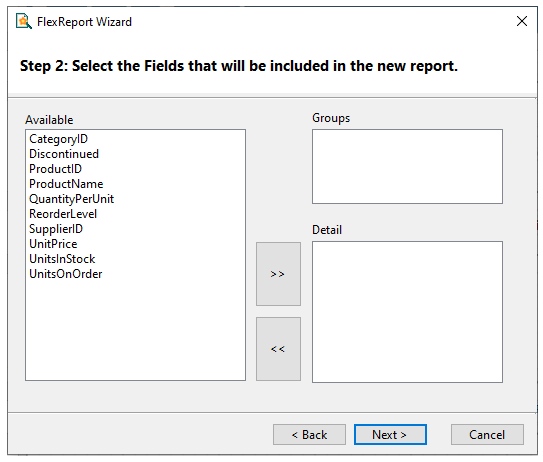
- [>>]ボタンをクリックして、残りのフィールドを[詳細]リストに移動します。
- [次へ]をクリックします。
- 新しいレポートのレイアウトを選択します。このページには、ページ内でのデータの構成方法を定義するいくつかのオプションが用意されています。レイアウトを選択すると、左側にサムネイルプレビューが表示され、ページ内でレイアウトがどのように表示されるかを確認できます。2 つのレイアウトグループがあります。1 つは、グループなしのレポート用のレイアウトグループ、もう 1 つはグループありのレポート用のレイアウトとグループです。目的とするレポートの最終的な外観に最も近いレイアウトを選択してください。また、このページでは、用紙の方向と、フィールドをページ幅に合わせて調整するかどうかを選択できます。
[アウトライン]レイアウトのままにします。
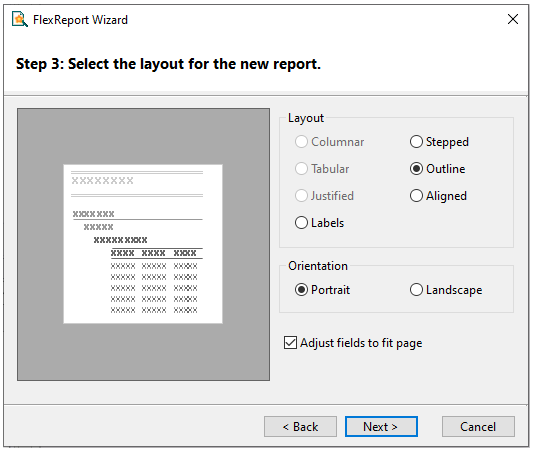
- [次へ]をクリックします。
- 新しいレポートのスタイルを選択します。このページでは、新しいレポートで使用するフォントと色を選択できます。前のページと同様に、プレビューが表示され、各スタイルがどのように表示されるかを確認できます。最適なスタイルを選択します(スタイルは後で変更したり、詳細に調整することができます)。
Verdana スタイルを選択します。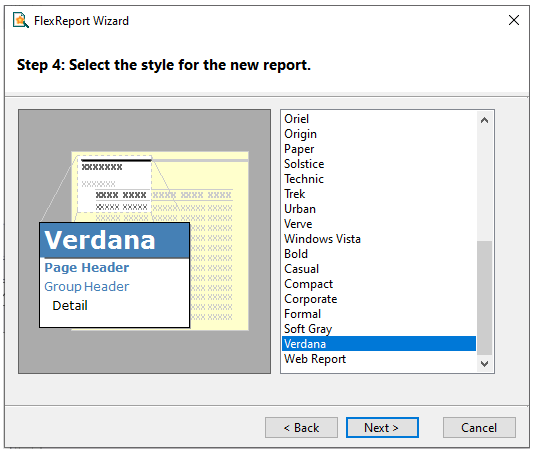
- [次へ]をクリックします。
- 新しいレポートのタイトルを選択します。この最後の手順のページでは、新しいページのタイトルを選択します。また、新しいレポートをすぐにプレビューするか、プレビューする前に編集モードに移動してデザインに手を加えるかを指定します。
新しいレポートのタイトルを入力します。たとえば、「Products Report」とします。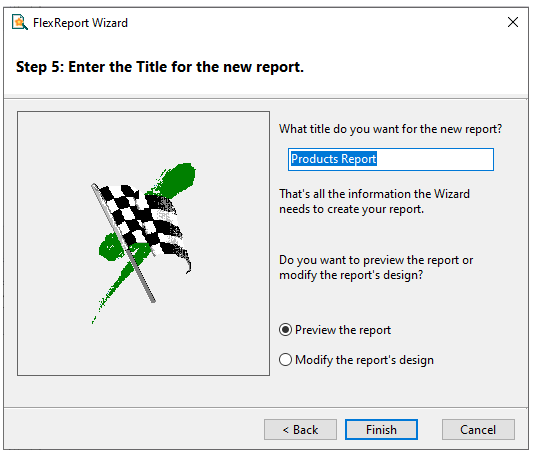
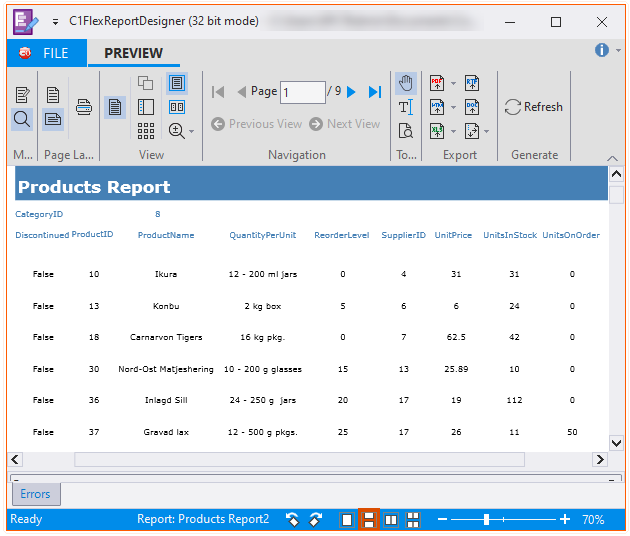
- [レポートのプレビュー]を選択し、[完了]をクリックします。デザイナのプレビューペインにレポートが直ちに表示されます。
-
省略符ボタンをクリックして、標準の接続文字列ビルダを起動します。[データリンクプロパティ]ダイアログボックスが開きます。
- .NET プロジェクトを作成し、C1FlexReport コンポーネントをツールボックスに追加します。
- ツールボックスで、C1FlexReport アイコンをダブルクリックして、このコンポーネントをプロジェクトに追加します。コンポーネントは、コンポーネントトレイ内でフォームの下に表示されます。
- C1FlexReport コンポーネントのスマートタグをクリックし、そのタスクメニューから[レポートの編集]を選択します。C1FlexReportDesigner が開き、C1FlexReport ウィザードによる 5 つの簡単な手順のガイドが開始されます。
この例では、コードを使用して、C1NWind データベースに基づく単純な表形式のレポート定義を作成します。コードにはコメントが付けられ、C1FlexReport オブジェクトモデルの最も重要な要素が例示されています。次の手順を実行します。
-
最初に、ボタンコントロール、FlexReport コンポーネント、および FlexViewer コントロールをフォームに追加します。次のプロパティを設定します。
コントロール/コンポーネント 名前 Button btnEmployees FlexReport flexReport FlexViewer flexViewer -
次に、C1NWind.mdb データベースから必要なデータを取得するように DataSource オブジェクトを設定します。それには、ConnectionString プロパティと RecordSource プロパティを使用します。
C# コードのコピー// DataSourceを初期化します DataSource ds = flexReport.DataSource; ds.ConnectionString = @"Provider=Microsoft.ACE.OLEDB.12.0;Data Source=C:\Users\GPCTAdmin\Documents\ComponentOne Samples\Common\C1NWind.mdb"; ds.RecordSource = "Employees";
-
Call a utility function RenderEmployees() and add the code lines within the function as given below:
C# コードのコピーprivate void RenderEmployees() { flexReport.DataSource.RecordSourceType = RecordSourceType.Auto; // 既存のフィールドをクリアします // flexReport.Clear(); // すべてのコントロールのデフォルトフォントを設定します flexReport.Font.Name = "Tahoma"; flexReport.Font.Size = 8; }
The code lines depict how to set a default font for the FlexReport component using the Font property. Further, the DataSource property in C1FlexReport class accesses the RecordSourceType enumeration to set the data source type. Setting the enumeration to Auto automatically determines the data source type based on the syntax used by the RecordSource property.
-
次に、ページ内のレポートのレイアウト方法を定義する Layout オブジェクトを初期化します。ここでは、レポートを Portrait(縦)モードでレンダリングし、Width を 6.5 インチ(ページ幅 8.5 インチから、両側のマージン各 1 インチを引いた値)に設定します。
C# コードのコピー//レイアウトを初期化します Layout l = flexReport.Layout; l.Orientation = OrientationEnum.Portrait; l.Width = 6.5 * 1440; -
次の手順は、興味深いものです。すべてのレポートには、5 つの基本セクション(詳細、レポートヘッダー、レポートフッター、ページヘッダー、ページフッター)があります。次のコードを使用して、レポートヘッダーを設定します。ここでは、いくつかのプロパティを設定し、タイトルフィールドを追加します。
C# コードのコピー// レポートのヘッダを作成します Section s = flexReport.Sections[SectionTypeEnum.Header]; s.Height = 1440; s.Visible = true; s.BackColor = Color.FromArgb(200, 200, 200); TextField textFld1 = new TextField(); textFld1.Name = "FldTitle"; textFld1.Text = "Employees Report"; textFld1.Left = 0; textFld1.Top = 0; textFld1.Width = 8000; textFld1.Height = 1440; textFld1.Font.Size = 24; textFld1.Font.Bold = true; textFld1.ForeColor = Color.FromArgb(0, 0, 100); flexReport.Sections.Header.Fields.Add(textFld1);
上記のセクションオブジェクトには、Fields コレクションがあります。このコレクションの Add メソッドは、新しいフィールドを作成し、それをセクションに割り当てます。パラメータで、新しいフィールドの Name、Text、Left、Top、Width、Height の各プロパティを指定しています。デフォルトでは、フィールドのフォントはコントロールと同じです。このフィールドはタイトルなので、フォントを変更してサイズを大きくしています。フォントサイズに合わせてフィールドの高さを十分大きくしてください。そうしないと、何も表示されなくなります。
-
次に、ページフッタセクションを設定します。このセクションは、テキストフィールドに式が含まれており、さらに興味深くなっています。テキストフィールド内の式を評価するには、TextField.Text.Expression プロパティに式を設定するだけです。テキストフィールド内の式は、レポートのレンダリング時に評価されます。C1Report では、フィールドの Calculated プロパティを True に設定することで、同じことを実現できます。ページフッターを作成するには、次のコードを追加します。
C# コードのコピー// ページのフッタを作成します s = flexReport.Sections[SectionTypeEnum.PageFooter]; s.Height = 500; s.Visible = true; TextField textFld2 = new TextField(); textFld2.Name = "FldFtrLeft"; textFld2.Text.Expression = @"""Employees: Printed on "" & Now"; textFld2.Left = 0; textFld2.Top = 0; textFld2.Width = 4000; textFld2.Height = 300; textFld2.Font.Size = 8; textFld2.Font.Bold = false; flexReport.Sections.PageFooter.Fields.Add(textFld2); TextField textFld3 = new TextField(); textFld3.Name = "FldFtrRight"; textFld3.Text.Expression = @"""Page "" + Page + "" of "" & Pages"; textFld3.Left = 4000; textFld3.Top = 0; textFld3.Width = 4000; textFld3.Height = 300; textFld3.Align = FieldAlignEnum.RightTop; textFld3.Width = flexReport.Layout.Width - textFld3.Left; flexReport.Sections.PageFooter.Fields.Add(textFld3); //ページのフッタの前に行を追加します ShapeField shpfld = new ShapeField(); shpfld.Name = "FldLine"; shpfld.ShapeType = ShapeType.Line; shpfld.Left = 0; shpfld.Top = 0; shpfld.Width = flexReport.Layout.Width; shpfld.Height = 20; flexReport.Sections.PageFooter.Fields.Add(shpfld);
このページフッタセクションの式では、VBScript 固有の変数ではなく、C1FlexReport で定義されている変数を使用しています。Page と Pages は、現在のページ番号と総ページ数が格納される変数です。このセクションでは、直線として表示されるように設定されたフィールドも使用されています。
-
次に、ページヘッダーセクションを設定します。このセクションは、各ページの上部にレンダリングされ、フィールドラベルが表示されます。ページヘッダーセクションを使用してフィールドラベルを表示するテクニックは、表形式のレポートでよく使用されます。コードは単純ですが、すべてのフィールドのサイズを指定しているため、見た目は多少煩雑です。実際のアプリケーションでは、これらの値はプログラムに組み込まれません。フィールドラベルを含むページヘッダーを作成するには、次のコードを追加します。
C# コードのコピー//フィールドラベルを使用してページヘッダーを作成します s = flexReport.Sections[SectionTypeEnum.PageHeader]; s.Height = 500; s.Visible = true; flexReport.Font.Bold = true; TextField textFld4 = new TextField(); textFld4.Name = "LblID"; textFld4.Text = "ID"; textFld4.Left = 0; textFld4.Top = 50; textFld4.Width = 400; textFld4.Height = 300; textFld4.Align = FieldAlignEnum.RightTop; flexReport.Sections.PageHeader.Fields.Add(textFld4); TextField textFld5 = new TextField(); textFld5.Name = "LblFirstName"; textFld5.Text = "First"; textFld5.Left = 500; textFld5.Top = 50; textFld5.Width = 900; textFld5.Height = 300; flexReport.Sections.PageHeader.Fields.Add(textFld5); TextField textFld6 = new TextField(); textFld6.Name = "LblLastName"; textFld6.Text = "Last"; textFld6.Left = 1500; textFld6.Top = 50; textFld6.Width = 900; textFld6.Height = 300; flexReport.Sections.PageHeader.Fields.Add(textFld6); TextField textFld7 = new TextField(); textFld7.Name = "LblTitle"; textFld7.Text = "Title"; textFld7.Left = 2500; textFld7.Top = 50; textFld7.Width = 2400; textFld7.Height = 300; flexReport.Sections.PageHeader.Fields.Add(textFld7); TextField textFld8 = new TextField(); textFld8.Name = "LblTitle"; textFld8.Text = "Notes"; textFld8.Left = 5000; textFld8.Top = 50; textFld8.Width = 8000; textFld8.Height = 300; flexReport.Sections.PageHeader.Fields.Add(textFld8); flexReport.Font.Bold = false; ShapeField shpfld2 = new ShapeField(); shpfld2.Name = "FldLine"; shpfld2.ShapeType = ShapeType.Line; shpfld2.Left = 0; shpfld2.Top = 400; shpfld2.Width = flexReport.Layout.Width; shpfld2.Height = 20; flexReport.Sections.PageHeader.Fields.Add(shpfld2);
このコードは、フォントを処理するための強力なテクニックを示しています。すべてのフィールドは、作成時にコントロールのフォントを継承するため、フィールドを作成する前にコントロールの Font.Bold プロパティを True に設定し、後で False に戻します。これで、ページヘッダーセクション内のすべてのコントロールのフォントが太字になります。
-
詳細セクションを追加して、レポートを完成させます。このセクションが、実際のデータを表示するセクションです。詳細セクションでは、ページヘッダーセクションの各ラベルの下のテキストフィールドに式を設定します。詳細セクションを作成するには、次のコードを追加します。
C# コードのコピー// 詳細セクションを作成します s = flexReport.Sections[SectionTypeEnum.Detail]; s.Height = 330; s.Visible = true; TextField textField = new TextField(); textField.Name = "FldID"; textField.Text.Expression = "EmployeeID"; textField.Left = 0; textField.Top = 0; textField.Width = 400; textField.Height = 300; flexReport.Sections.Detail.Fields.Add(textField); TextField textField1 = new TextField(); textField1.Name = "FldFirstName"; textField1.Text.Expression = "FirstName"; textField1.Left = 500; textField1.Top = 0; textField1.Width = 900; textField1.Height = 300; flexReport.Sections.Detail.Fields.Add(textField1); TextField textField2 = new TextField(); textField2.Name = "FldLastName"; textField2.Text.Expression = "LastName"; textField2.Left = 1500; textField2.Top = 0; textField2.Width = 900; textField2.Height = 300; flexReport.Sections.Detail.Fields.Add(textField2); TextField textField3 = new TextField(); textField3.Name = "FldTitle"; textField3.Text.Expression = "Title"; textField3.Left = 2500; textField3.Top = 0; textField3.Width = 2400; textField3.Height = 300; flexReport.Sections.Detail.Fields.Add(textField3); TextField textField4 = new TextField(); textField4.Name = "FldNotes"; textField4.Text.Expression = "Notes"; textField4.Left = 5000; textField4.Top = 0; textField4.Width = 8000; textField4.Height = 300; flexReport.Sections.Detail.Fields.Add(textField4); textField4.Width = flexReport.Layout.Width - textField4.Left; textField4.AutoHeight = AutoSizeBehavior.CanGrow; textField4.Font.Size = 6; textField4.Align = FieldAlignEnum.JustTop; //詳細セクションの各フィールドの後に行を追加します ShapeField shpfld3 = new ShapeField(); shpfld3.Name = "FldLine"; shpfld3.ShapeType = ShapeType.Line; shpfld3.Left = 0; shpfld3.Top = 310; shpfld3.Width = flexReport.Layout.Width; shpfld3.Height = 20; flexReport.Sections.Detail.Fields.Add(shpfld3);
すべてのテキストフィールドに式が含まれており、各テキストフィールドはソースレコードソース内のフィールド名に対応しています。TextField.Text.Expression プロパティに式を設定することで、Text プロパティは、リテラルとしてレンダリングされるのではなく、データベースのフィールド名として解釈されます。レポートのフィールド名がレコードセットのフィールド名とは異なる一意の名前となるような命名規則を採用することが重要です。たとえば、「LastName」という名前のフィールドが 2 つあると、「Left(LastName,1)」のような式はあいまいになります。この例では、レポートのフィールド名はすべて「Fld」で始まるという命名規則を採用しました。
「FldNotes」フィールドは、AutoHeight プロパティが CanGrow に設定され、他のフィールドより小さいフォントが設定されています。これは、データベースの「Notes」フィールドに長いテキストが含まれていても、レポートに表示されるようにするためです。フィールドの高さを大きく設定して無駄なスペースを作るのではなく、AutoHeight プロパティを CanGrow に設定して、コンテンツに合わせて必要に応じてフィールドが拡大するようにしています。また、このフィールドを含むセクションの AutoHeight プロパティも True に設定して、フィールドがセクションからはみ出さないようにしています。
-
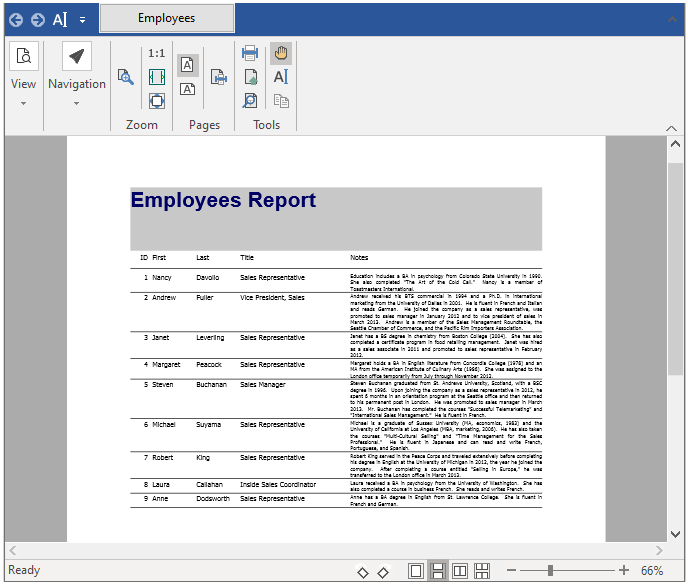
これで、レポート定義は完了です。レポートを C1FlexViewer コントロールにレンダリングするには、Employees ボタンをダブルクリックして、btnEmployees_Click イベントにイベントハンドラを追加します。コードエディタが表示され、イベントハンドラ内に挿入ポイントが配置されます。次のコードを入力します。
C# コードのコピーprivate void btnEmployees_Click(object sender, EventArgs e) { RenderEmployees(); flexViewer.DocumentSource = flexReport; }
基本レポートの外観は次のようになります。
レポートの修正
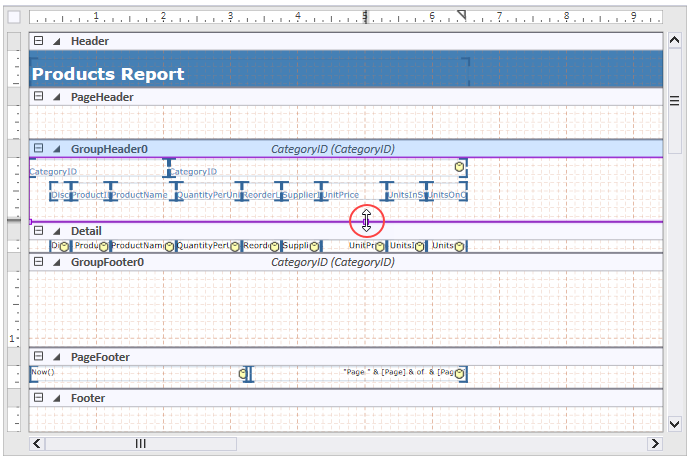
プレビューモードの FlexReportDesigner では、レポートを調整することはできません。[設計]ボタンをクリックしてデザインモードに切り替え、修正を開始します。メインウィンドウの右ペインがプレビューモードから設計モードに切り替わり、レポートを構成するコントロールとフィールドが表示されます。
この例では、グループヘッダーセクションのサイズ変更、およびフィールド値の書式設定を行います。それには、次の手順に従います。
- グループヘッダーセクションのサイズを変更するには、境界線を選択し、マウスポインタを使用して目的の位置までドラッグします。
- マウスポインタでフィールドの角にあるハンドルをドラッグして、フィールドのサイズを変更します。
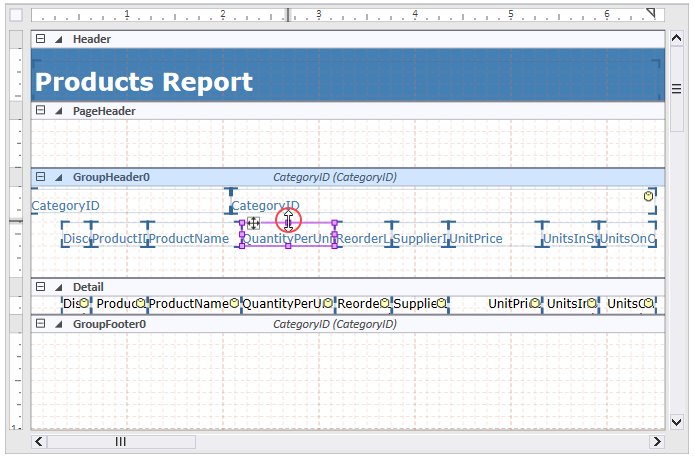 ヒント:テキストがフィールドに収まらない場合は、プロパティペインでフィールドの Appearance.WordWrap プロパティを True に設定します。
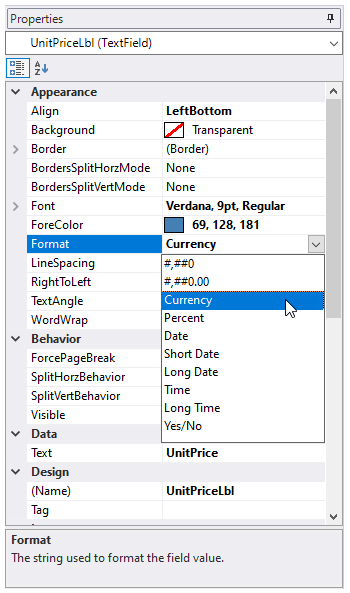
 - プロパティペインで、Unit Price 列の下にある詳細セクションの UnitPriceCtl フィールドを選択します。
- フィールドの Appearance.Format プロパティを Currency に設定します。
- [プレビュー]ボタンをクリックしてプレビューモードに切り替え、修正を確認します。
- [設計]ボタンをクリックして、プレビューモードから設計モードに切り替えます。
- [ファイル]メニューをクリックして、表示されるメニューから[名前を付けて保存]を選択します。
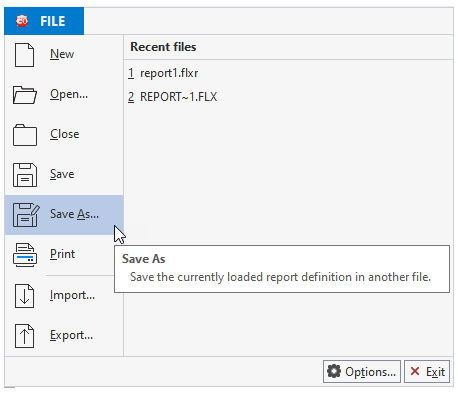
- [レポート定義ファイルの保存]ダイアログボックスで、[ファイル名]ボックスに「ProductsReport.flxr」と入力します。後で使用するために、覚えやすい場所にファイルを保存します。
- デザイナを閉じて、Visual Studio プロジェクトに戻ります。
これで、レポート定義ファイルを作成できました。次の手順では、C1FlexReport コンポーネントにレポートをロードします。
レポートのロードとレンダリング
設計時にファイルからレポート定義をロードするには、次のいずれかのタスクを実行します。
- C1FlexReport コンポーネントを右クリックし、[レポートのロード]メニューオプションを選択します。
または
- C1FlexReport コンポーネントの上のスマートタグ(
 )をクリックし、[C1FlexReport のタスク]メニューから[レポートの読み込み]を選択します。
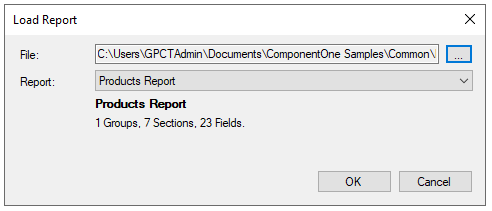
Using the Load Report dialog box, select the report you want and complete the following tasks:
- 省略符ボタンをクリックします。[開く]ダイアログボックスが表示されます。
- ProductsReport.flxr ファイルを保存した場所を参照し、そのファイルを選択して、[開く]をクリックします。
- [レポート]ドロップダウンボックスに有効なレポート定義がリストされます。ロードする[Products Report]定義を選択します。
- [ロード]をクリックし、[OK]をクリックして、ダイアログボックスを閉じます。
You can also load a report definition from a file via code. For this purpose, double-click the form and enter the following code in the Form1_Load event handler:
| C# |
コードのコピー
|
|---|---|
private void Form1_Load(object sender, EventArgs e) { // リソースマネージャを作成します ComponentResourceManager resources = new ComponentResourceManager(typeof(Form1)); // レポート定義を格納するリソース文字列を取得します c1FlexReport1.ReportDefinition = resources.GetString("c1FlexReport1.ReportDefinition"); // レポート名を設定します c1FlexReport1.ReportName = "Products Report"; } |
|
次の手順では、レポートをプレビューコントロールにレンダリングします。
レポート定義を作成し、データソースを定義して C1FlexReport コンポーネントにロードしたら、レポートをプリンタやプレビューコントロール C1FlexViewer にレンダリングしたり、別のファイル形式にエクスポートすることができます。
FlexViewer コントロールでレポートをプレビューするには、次の手順に従います。
- ツールボックスから、FlexViewer コントロールをダブルクリックしてプロジェクトに追加します。
- プロパティウィンドウで、FlexViewer.Dock プロパティを Fill に設定します。
- マウスで Windows フォームを選択し、ドラッグしてサイズ変更します。
- フォームをダブルクリックし、Form_Load イベントハンドラに次のコードを入力します。
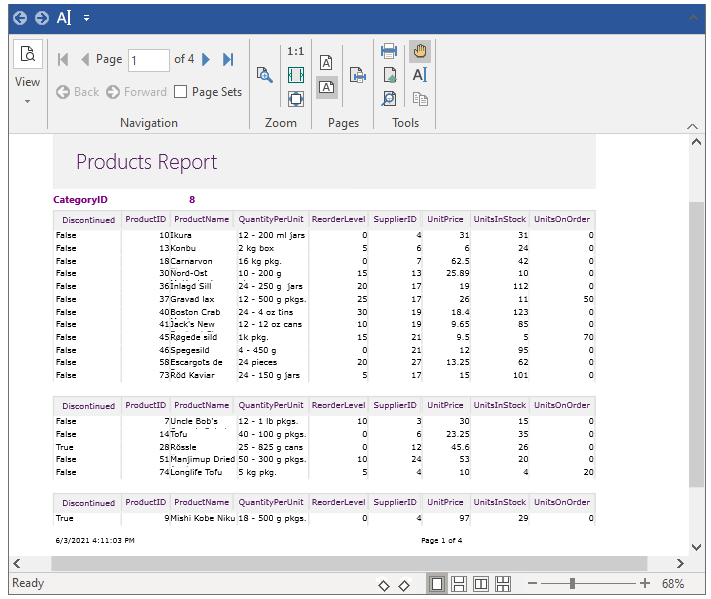
C# コードのコピーprivate void Form1_Load(object sender, EventArgs e) { //レポート定義をロードします c1FlexReport1.Load(@"..\..\Products Report.flxr", "Products Report"); //レポートをプレビューします c1FlexViewer1.DocumentSource = c1FlexReport1; }
- Press F5 to run the code. Observe the output. It looks as shown below:
 Note: WinForms .NET 5 Edition does not include rich design-time support yet. We will enhance it in the future releases.