折れ線チャートには、折れ線に矢印の始点や終点を表示するなど、スタイルに関する特別な設定が提供されます。点線、線の先端(キャップ)のスタイルなど、折れ線に関する様々なスタイルを指定できます。
設定方法
- 折れ線チャートの系列を表すLineSeriesクラスのインスタンスを作成します。
- EnhancedSolidLineオブジェクトを作成し、折れ線に関するスタイルを設定します。
- 作成したEnhancedSolidLineオブジェクトを、LineSeriesオブジェクトのLineBorderプロパティに設定します。
サンプルコード
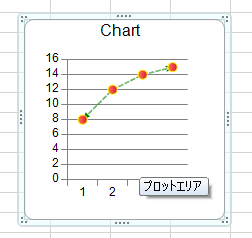
次のサンプルコードは、矢印を含む折れ線スタイルを使用した折れ線チャートを作成します。
| C# |
コードのコピー
|
|---|---|
FarPoint.Win.Chart.EnhancedSolidLine eh = new FarPoint.Win.Chart.EnhancedSolidLine(System.Drawing.Color.Green, 1, FarPoint.Win.Chart.CompoundType.Double, FarPoint.Win.Chart.DashType.Dash, FarPoint.Win.Chart.CapType.Flat, FarPoint.Win.Chart.JoinType.Round, FarPoint.Win.Chart.ArrowType.Arrow, FarPoint.Win.Chart.ArrowType.OpenArrow, 1, 2); FarPoint.Win.Chart.LineSeries series1 = new FarPoint.Win.Chart.LineSeries(); series1.PointMarker = new FarPoint.Win.Chart.BuiltinMarker(FarPoint.Win.Chart.MarkerShape.Circle, 7.0f); series1.PointFill = new FarPoint.Win.Chart.GradientFill(System.Drawing.Color.Coral, System.Drawing.Color.Crimson); series1.PointBorder = new FarPoint.Win.Chart.SolidLine(System.Drawing.Color.Yellow); series1.LineBorder = eh; series1.Values.Add(8.0); series1.Values.Add(12.0); series1.Values.Add(14.0); series1.Values.Add(15.0); FarPoint.Win.Chart.YPlotArea plotArea = new FarPoint.Win.Chart.YPlotArea(); plotArea.Location = new System.Drawing.PointF(0.2f, 0.2f); plotArea.Size = new System.Drawing.SizeF(0.6f, 0.6f); plotArea.Series.Add(series1); FarPoint.Win.Chart.LabelArea labelArea = new FarPoint.Win.Chart.LabelArea(); labelArea.Location = new System.Drawing.PointF(0.5f, 0.02f); labelArea.AlignmentX = 0.5f; labelArea.AlignmentY = 0.0f; labelArea.Text = "Chart"; FarPoint.Win.Chart.ChartModel model = new FarPoint.Win.Chart.ChartModel(); model.LabelAreas.Add(labelArea); model.PlotAreas.Add(plotArea); FarPoint.Win.Spread.Chart.SpreadChart chart = new FarPoint.Win.Spread.Chart.SpreadChart(); chart.Size = new Size(200, 200); chart.Location = new Point(100, 100); chart.Model = model; fpSpread1.Sheets[0].Charts.Add(chart); |
|
| Visual Basic |
コードのコピー
|
|---|---|
Dim eh As New FarPoint.Win.Chart.EnhancedSolidLine(System.Drawing.Color.Green, 1, FarPoint.Win.Chart.CompoundType.Double, FarPoint.Win.Chart.DashType.Dash, FarPoint.Win.Chart.CapType.Flat, FarPoint.Win.Chart.JoinType.Round, FarPoint.Win.Chart.ArrowType.Arrow, FarPoint.Win.Chart.ArrowType.OpenArrow, 1, 2) Dim series1 As New FarPoint.Win.Chart.LineSeries() series1.PointMarker = New FarPoint.Win.Chart.BuiltinMarker(FarPoint.Win.Chart.MarkerShape.Circle, 7.0F) series1.PointFill = New FarPoint.Win.Chart.GradientFill(System.Drawing.Color.Coral, System.Drawing.Color.Crimson) series1.PointBorder = New FarPoint.Win.Chart.SolidLine(System.Drawing.Color.Yellow) series1.LineBorder = eh series1.Values.Add(8.0) series1.Values.Add(12.0) series1.Values.Add(14.0) series1.Values.Add(15.0) Dim plotArea As New FarPoint.Win.Chart.YPlotArea() plotArea.Location = New System.Drawing.PointF(0.2F, 0.2F) plotArea.Size = New System.Drawing.SizeF(0.6F, 0.6F) plotArea.Series.Add(series1) Dim labelArea As New FarPoint.Win.Chart.LabelArea() labelArea.Location = New System.Drawing.PointF(0.5F, 0.02F) labelArea.AlignmentX = 0.5F labelArea.AlignmentY = 0.0F labelArea.Text = "Chart" Dim model As New FarPoint.Win.Chart.ChartModel() model.LabelAreas.Add(labelArea) model.PlotAreas.Add(plotArea) Dim chart As New FarPoint.Win.Spread.Chart.SpreadChart() chart.Size = New Size(200, 200) chart.Location = New Point(100, 100) chart.Model = model FpSpread1.Sheets(0).Charts.Add(chart) |
|