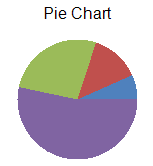
円チャートは、コードまたはデザイナを使用して作成できます。次の図は、円チャートの例です。
APIに関する詳細は、PiePlotAreaクラスを参照してください。また、円チャートの作成には、円チャートのデータ系列を表すPieSeriesクラスを使用します。
 |
|
設定方法
- 円チャートのデータ系列を表すPieSeriesオブジェクトを作成し、データを追加します。
- プロットエリアを表すPiePlotAreaオブジェクトを作成し、位置とサイズを設定します。
- プロットエリアにデータ系列を追加します。
- ラベル、および凡例エリアを作成します。
- ChartModelオブジェクトを作成し、プロットエリア、ラベル、および凡例エリアを追加します。
- チャートにチャートモデルを割り当てます。
サンプルコード
次のサンプルコードは、円チャートを作成する例です。
| C# |
コードのコピー
|
|---|---|
FarPoint.Win.Chart.PieSeries series = new FarPoint.Win.Chart.PieSeries(); series.SeriesName = "Series 0"; series.Values.Add(1.0); series.Values.Add(2.0); series.Values.Add(4.0); series.Values.Add(8.0); FarPoint.Win.Chart.PiePlotArea plotArea = new FarPoint.Win.Chart.PiePlotArea(); plotArea.Location = new PointF(0.2f, 0.2f); plotArea.Size = new SizeF(0.6f, 0.6f); plotArea.Series.Add(series); FarPoint.Win.Chart.LabelArea label = new FarPoint.Win.Chart.LabelArea(); label.Text = "Pie Chart"; label.Location = new PointF(0.5f, 0.02f); label.AlignmentX = 0.5f; label.AlignmentY = 0.0f; FarPoint.Win.Chart.LegendArea legend = new FarPoint.Win.Chart.LegendArea(); legend.Location = new PointF(0.98f, 0.5f); legend.AlignmentX = 1.0f; legend.AlignmentY = 0.5f; FarPoint.Win.Chart.ChartModel model = new FarPoint.Win.Chart.ChartModel(); model.LabelAreas.Add(label); model.LegendAreas.Add(legend); model.PlotAreas.Add(plotArea); chart2DControl1.Model = model; |
|
| Visual Basic |
コードのコピー
|
|---|---|
Dim series As New FarPoint.Win.Chart.PieSeries() series.SeriesName = "Series 0" series.Values.Add(1.0) series.Values.Add(2.0) series.Values.Add(4.0) series.Values.Add(8.0) Dim plotArea As New FarPoint.Win.Chart.PiePlotArea() plotArea.Location = New PointF(0.2F, 0.2F) plotArea.Size = New SizeF(0.6F, 0.6F) plotArea.Series.Add(series) Dim label As New FarPoint.Win.Chart.LabelArea() label.Text = "Pie Chart" label.Location = New PointF(0.5F, 0.02F) label.AlignmentX = 0.5F label.AlignmentY = 0.0F Dim legend As New FarPoint.Win.Chart.LegendArea() legend.Location = New PointF(0.98F, 0.5F) legend.AlignmentX = 1.0F legend.AlignmentY = 0.5F Dim model As New FarPoint.Win.Chart.ChartModel() model.LabelAreas.Add(label) model.LegendAreas.Add(legend) model.PlotAreas.Add(plotArea) Chart2DControl1.Model = model |
|
SPREAD デザイナの使用
- [チャートデザイナ]を起動します。
- 左側のツリーメニューから対象の[チャートモデル]を選択します。
- 右側のプロパティリストの[その他]セクションのProtAreasから[プロットエリアコレクションエディタ]を開きます。
- [追加]ボタンの右横のドロップダウンボタンをクリックします。
- PiePlotAreaを選択して追加し、各プロパティを必要に応じて設定します。
|
[チャートデザイナ]の起動については、「SPREADデザイナガイド」の「チャートデザイナ」を参照してください。 |